
Asset Risk Visibility & Response
From platform-wide exposure to one-click remediation
problem //
Security teams needed to go from “how exposed are we” to “here’s exactly what to fix” without bouncing between four separate tools.
Solutions
5 solutionsGlanceable risk posture
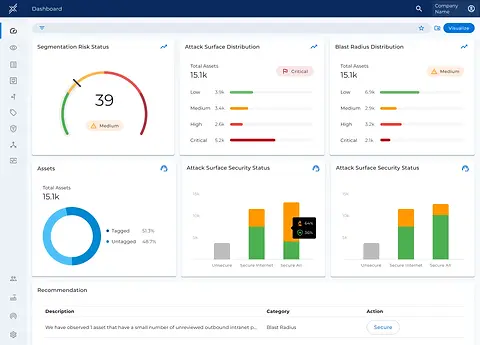
One score, one view, zero digging required.
Triage at scale
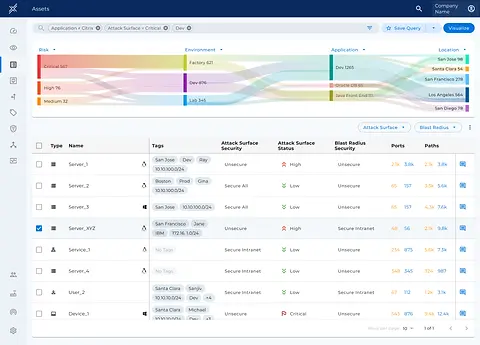
Sankey flow surfaces where risk clusters by environment, app, and location.
Drill into one asset
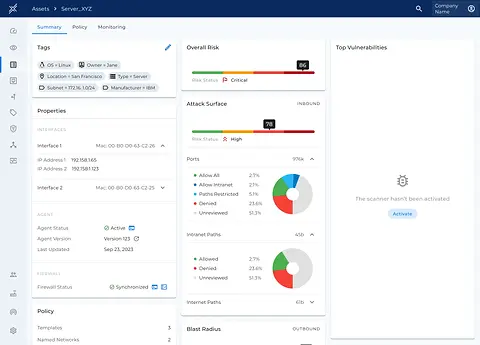
Tags, risk, attack surface, and blast radius, all in one place.
Make the fix simple
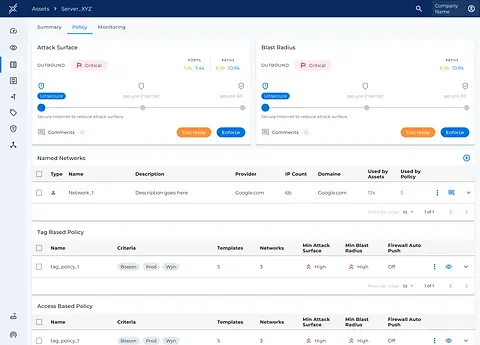
A three-stage slider (Unsecure → Secure Internet → Secure All) turns a technical config into something anyone can adjust confidently. Test Mode before you commit.
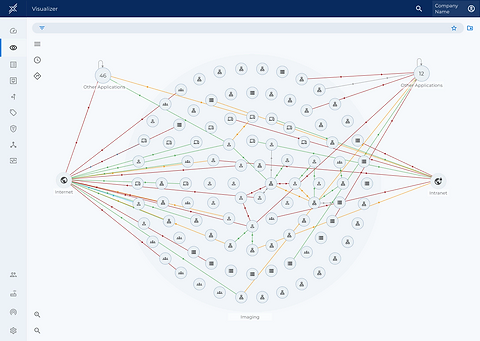
See it in context
Relationships and exposure, mapped spatially.
outcome //
One continuous flow replaced four disconnected tools, supporting ColorTokens’ shift to a unified platform.
abstract //
Joined ColorTokens as founding designer before the company had a shipping product. Over seven years I took four enterprise SaaS platforms from 0 to 1 — Xshield, Xprotect, Xaccess, and Xcloud — conceived the Data Visualizer that made invisible east-west traffic legible, built the design system that scaled across the suite, and owned the company's full brand identity.
Use case #02
Asset Visualizer